Vercel's October 2026 AI Gateway Production Index, published on October 15 and covering September traffic, reports that open-weight models processed 71.5% of the tokens routed through its gateway but accounted for only about 23% of estimated spend. It also reports that nearly one in two teams changed their most-used model in September and that average price per token fell 47%. Because the data comes from one vendor's gateway, it describes the behavior of that gateway's paid customers and not the whole market, but it is a rare look at production routing choices. This article summarizes the figures, derives what they imply about relative price, and flags where the report is internally inconsistent.
The headline split
The report states that open-weight models handled 71.5% of gateway tokens and about 23% of spend, and that the open-weight share of spend rose from about 5% in June to nearly 25% in September, more than quadrupling. The implied closed-weight shares, which Vercel does not state directly, are therefore about 28.5% of tokens and about 77% of spend.
Share of gateway tokens versus share of spend, September 2026
Percent of AI Gateway totals. Spend is estimated at list prices, so actual bills may differ. The "All open-weight" spend figure is "about 23%" in the report.
What the split implies about price
Dividing each group's share of spend by its share of tokens gives a relative price index, where 1.0 is the gateway average. This is a derived calculation from the report's rounded figures, so it is approximate and reflects the mix of models and providers on the gateway, not a like-for-like price comparison.
| Group | Share of tokens | Share of spend | Spend share per token share |
|---|---|---|---|
| All open-weight | 71.5% | ~23% | ~0.32 |
| Implied closed-weight | ~28.5% | ~77% | ~2.70 |
| DeepSeek models | 58% | 6.6% | ~0.11 |
| Z.ai (GLM) | 7.2% | 4.5% | ~0.63 |
| Moonshot AI (Kimi) | 3.6% | 13.2% | ~3.7 |
On those numbers, the implied closed-weight group spent about 8.4 times more per token than the open-weight group (2.70 divided by 0.32). The lab-level rows show how wide the spread inside the open-weight group is: DeepSeek's tokens cost the gateway's customers roughly a ninth of the gateway average, while Kimi's cost nearly four times it. The figures are list-price estimates; the report notes actual bills may differ, and token volume includes input, output, reasoning, cached-input and cache-creation tokens, which are priced differently.
Other figures from the report
- Spend growth. September spend was about 13 times December's, up 1,180%. Frontier spend grew tenfold since December, while open-weight spend grew more than seventyfold.
- Provider concentration. Anthropic's share of gateway spend fell from 63.7% in August to 43.9% in September. Opus was nearly a third of September spend, down from about half in August. This is a share of one gateway's spend, not of Anthropic's revenue.
- DeepSeek. Its models took 58% of tokens and 6.6% of spend, and DeepSeek-v4.1-Flash alone was nearly half of September tokens and 2.6% of spend. Our coverage of the DeepSeek V4.1-Flash-1017 update covers that model.
- Who serves Chinese-origin models. Nearly 70% of September spend on Chinese-origin models went through US-based providers, up from under 10% in December. US providers handled about 9 in 10 of Kimi's tokens and about 7 in 10 of GLM's, while DeepSeek served over 4 in 5 of its own tokens.
- Switching. Nearly one in two teams changed their most-used model, and almost one in three changed their most-used lab, an index record. Among teams that increased open-weight spend, 68% also increased closed-weight spend.
- Portfolio breadth. Teams with at least 10 million tokens averaged 15 models, 26 at 100 million and 42 at one billion.
Most teams that spent more on open-weight models also spent more on closed ones. The data describes portfolios, not replacements.
Reading the report's 68% figure
Reading the data carefully
Three cautions apply. First, the sample is paid teams on one gateway, which skews toward developers who already route across providers and are likely more price-sensitive than the average enterprise. Second, price per token is not price per task: a model that needs more reasoning tokens to solve a problem can cost more per outcome even at a lower per-token price, a theme explored in Reflection's Beam, which targets fewer tokens rather than cheaper ones. Third, the report contains discrepancies. Its figure for the new Jev model's spend share appears as 0.27%, 0.15% and 0.3% in different places, and one model's launch date differs between tables, so such details are best treated as unverified. The report's heading that price per token "halves" also overstates a 47% decline.
The 47% decline is the part least tied to any single event: it is an average across a changing mix, so it can fall because individual prices fell, because traffic moved to cheaper models, or both. The report's own numbers, a rising open-weight spend share alongside a falling average price, are consistent with a mix shift, though the report does not break the decline into those components.
What it means for teams
The practical implication is that model choice looks increasingly like a routing decision per workload, not a vendor commitment. Gateways, aggregators and tools such as Metir AI exist to make that switching cheap, and the switching rates in this report suggest buyers are using that option. For the broader gateway market, see our earlier piece on Stripe's reported $7 billion OpenRouter deal.
Sources:
Image credits
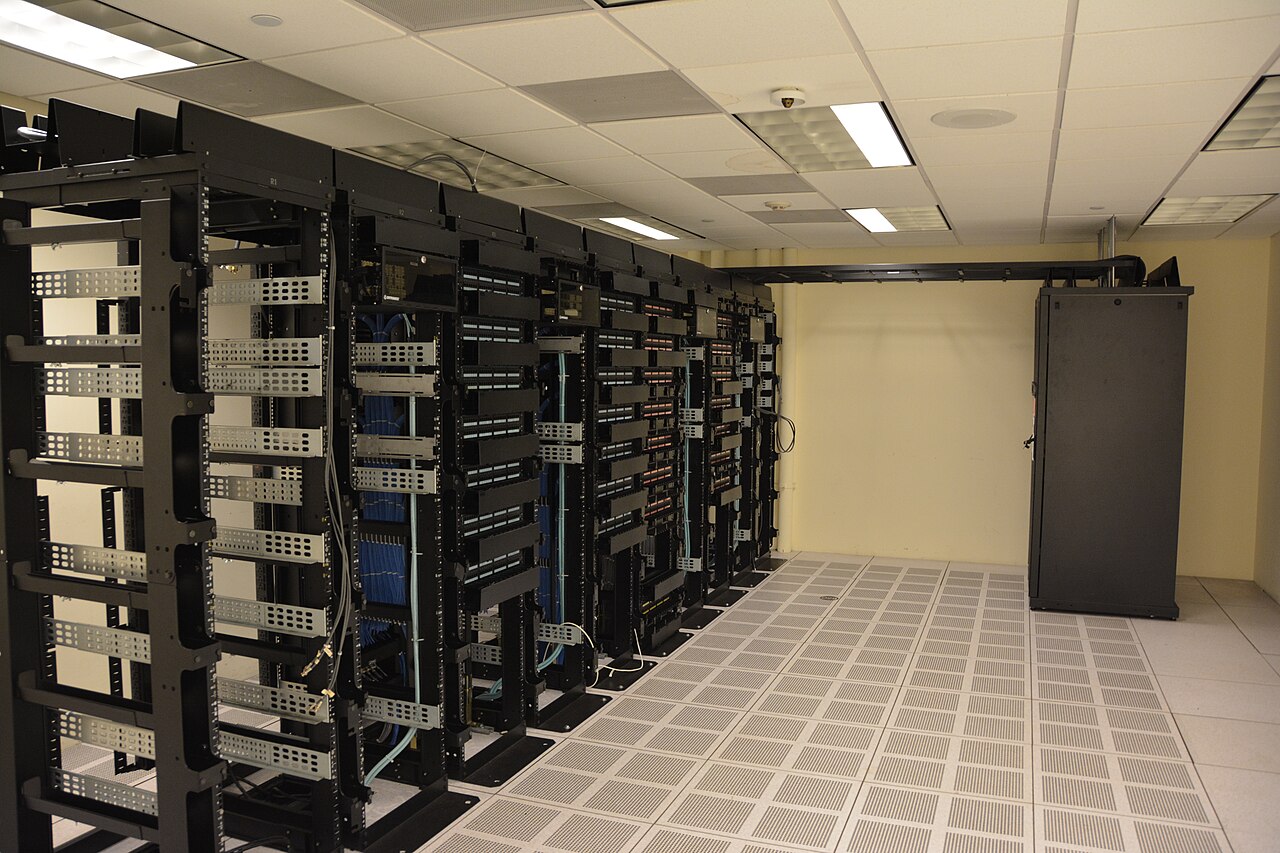
Header and in-body image: server racks in a data center, by Carl Lender, via Wikimedia Commons, licensed CC BY 2.0. Illustrative only.