The Philadelphia Semiconductor Index (SOX) closed Friday, October 16, 2026, down 3.83% at 11,137.29, its eighth consecutive losing session and, according to closing-day coverage, its longest losing streak since October 2008. The Nasdaq 100 fell about 2.5% the same day, and 24/7 Wall St. reported that technology stocks lost more than $1 trillion in value on the session. This article lays out what was reported, what drove it, and how this episode compares with the 2008 streak it is being measured against.
 NVIDIA
 AMD
AMD Microsoft
What was reported
According to 24/7 Wall St., the iShares Semiconductor ETF (SOXX) fell 4.14% to $493.39 on October 16. It had closed at $589.45 on October 6, so it was about 16% lower over that stretch and about 25% below its 52-week high of $655.95, although it was still up 64.12% for 2026.
Individual stocks were hit unevenly. On the day, AMD fell 5.95%, Intel 5.79%, Micron 5.63%, Marvell 5.56%, KLA 5.00%, Lam Research 4.87%, Applied Materials 4.82% and Broadcom 4.52%. Nvidia fell 1.43%. AMD was down 18.58% from its October 6 close, to $528.75.
One-day moves in major chip stocks, October 16, 2026
Percentage change on the day the Philadelphia Semiconductor Index fell 3.83%. Nvidia, highlighted, fell far less than most peers.
Sources disagree on one comparison point. Early Bloomberg-based reports said the streak was on course to match the longest since 2006, while closing reports, including 24/7 Wall St. and Futu News, described it as the longest since 2008. This article uses the later, closing-day framing and notes the discrepancy.
What drove it
Coverage cited several overlapping causes rather than a single trigger:
- Doubts about AI spending returns. 24/7 Wall St. quoted Bank of America analyst Sebastian Raedler, who said consensus hyperscaler capex forecasts have tripled, from $330 billion in early 2025 to $1 trillion, and that most major capital cycles of the past have ended in disappointment.
- Oil. West Texas crude reached $101.91 on October 14, per the same report.
- Rates. The 10-year Treasury yield stood at 5.10% on October 15, which the report linked to rising odds of a Federal Reserve rate hike. Other coverage also pointed to hotter-than-expected inflation raising concerns that borrowing costs for AI infrastructure could stay elevated.
- Memory-specific worries. Briefs and BigGo coverage noted the Roundhill Memory ETF (DRAM) fell about 6% on Friday, with supply-side concerns and Chinese competition cited.
- Credit stress at neoclouds. CoreWeave fell almost 12% on Friday, extending its weekly loss to about 25%, with total debt reported above $50 billion and its 2032 notes yielding close to 15%, according to market coverage including Briefs and BigGo. We covered the earlier bond move in our CoreWeave bond yield analysis.
Analysis: why 2026 is not 2008
A losing streak of this length invites comparison with 2008, but the stated drivers differ. 24/7 Wall St. noted that the 2008 slide happened amid a credit crisis, while this episode is attributed to oil, rates and doubts about AI spending. One measure in the data supports the contrast: the VIX was 16.46 on October 15, below the 20 level that is commonly read as high fear. A streak can be long without a panic-level fear gauge, which is what the figures show here.
Three analytical points follow from the numbers.
- Dispersion is informative. Nvidia's 1.43% decline against 4.5% to 6% for many peers suggests investors were not treating all AI-exposed chip stocks alike. Reasons are not established in the reports; possible readings include differing exposure to memory pricing, to financing-dependent customers, or to valuation (24/7 Wall St. noted AMD traded at about 199 times trailing earnings). These are hypotheses, not findings.
- The cost-of-capital channel is the common thread. Rates, inflation and neocloud bond yields all act through financing costs. Nvidia CEO Jensen Huang told Bloomberg the rout would pass and that Nvidia's own cost of capital is decreasing, which is a statement about one company's balance sheet rather than the sector's.
- A streak is a statistic about sequence, not size. The SOXX was still up 64.12% for the year after the drop, so the declines unwound a portion of a very large run rather than erasing it.
Why the capex number matters
The Raedler figure is the clearest link between a market streak and the AI buildout: forecasts tripling in under two years means chip demand depends on a small group of buyers sustaining spending. If capex guidance is revised, the effect reaches GPU makers, memory suppliers and equipment makers at once, which matches the breadth of Friday's declines across KLA, Lam and Applied Materials.
What to watch next
- Whether upcoming earnings from chip and cloud companies change capex guidance.
- The 10-year yield and inflation prints, given their role in the narrative.
- Credit spreads on neocloud debt, which several reports used as an early warning.
- Memory pricing and Chinese memory supply, flagged in the DRAM ETF coverage.
For teams building on AI, the practical takeaway is vendor concentration risk: tools that keep applications portable across model providers, as model-agnostic products such as Metir AI do, limit exposure to any single supplier's financing conditions.
Sources:
- Chip Stocks Just Fell 8 Days in a Row, Their Longest Losing Streak Since 2008 (24/7 Wall St., Oct 17, 2026)
- Chip index SOX posts longest losing streak since 2008 as AI worries deepen (Finwire)
- US chip stocks extend losing streak to eight days (Futu News)
- Chip Selloff Fuels $32B Short Gains (Briefs)
- Nvidia's Huang Tells Bloomberg AI Market Rout Will 'Pass' (AI Weekly)
- Nasdaq falls as memory chips lead semiconductor rout (BigGo Finance)
Image credits
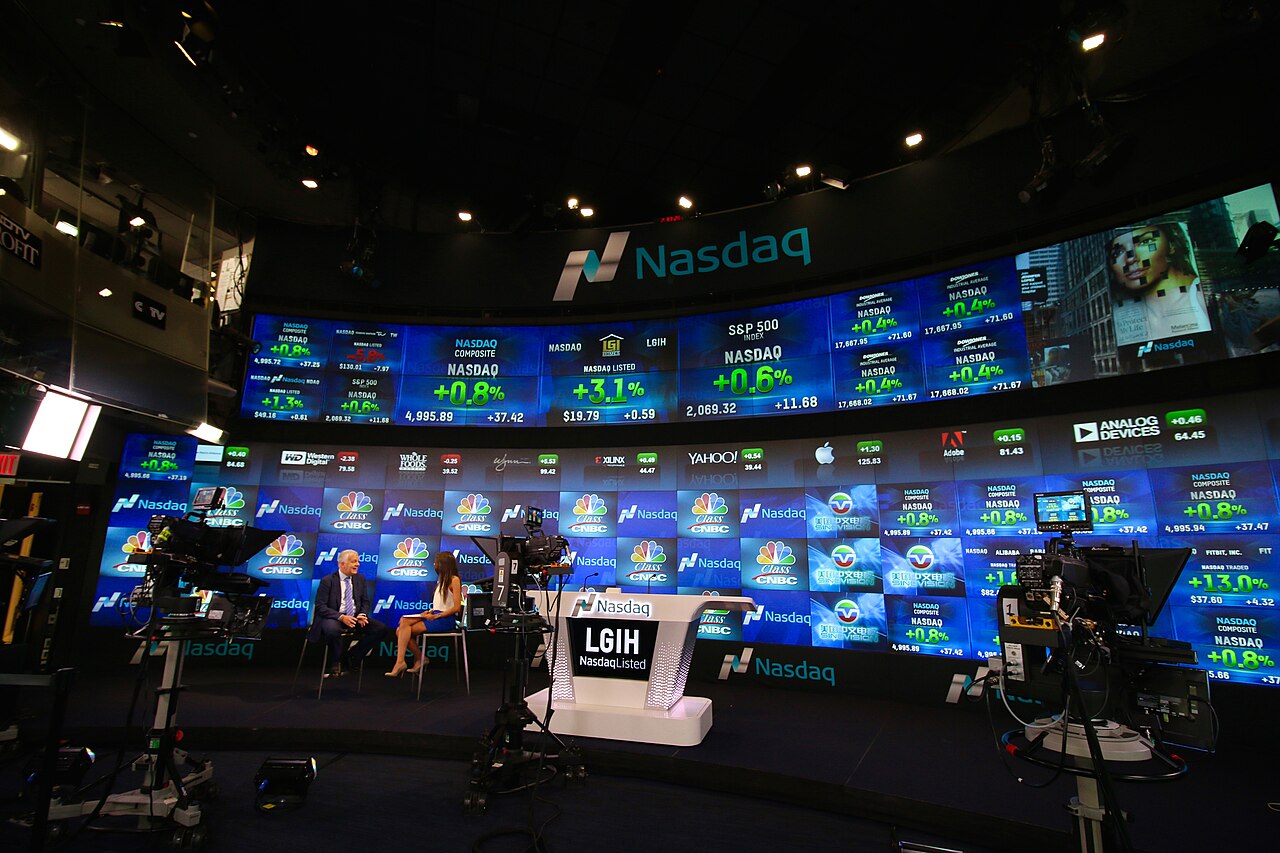
- Hero: Nasdaq MarketSite broadcast studio, Times Square, New York. A generic Nasdaq venue, not specific to this event. Wikimedia Commons, CC BY 2.0.
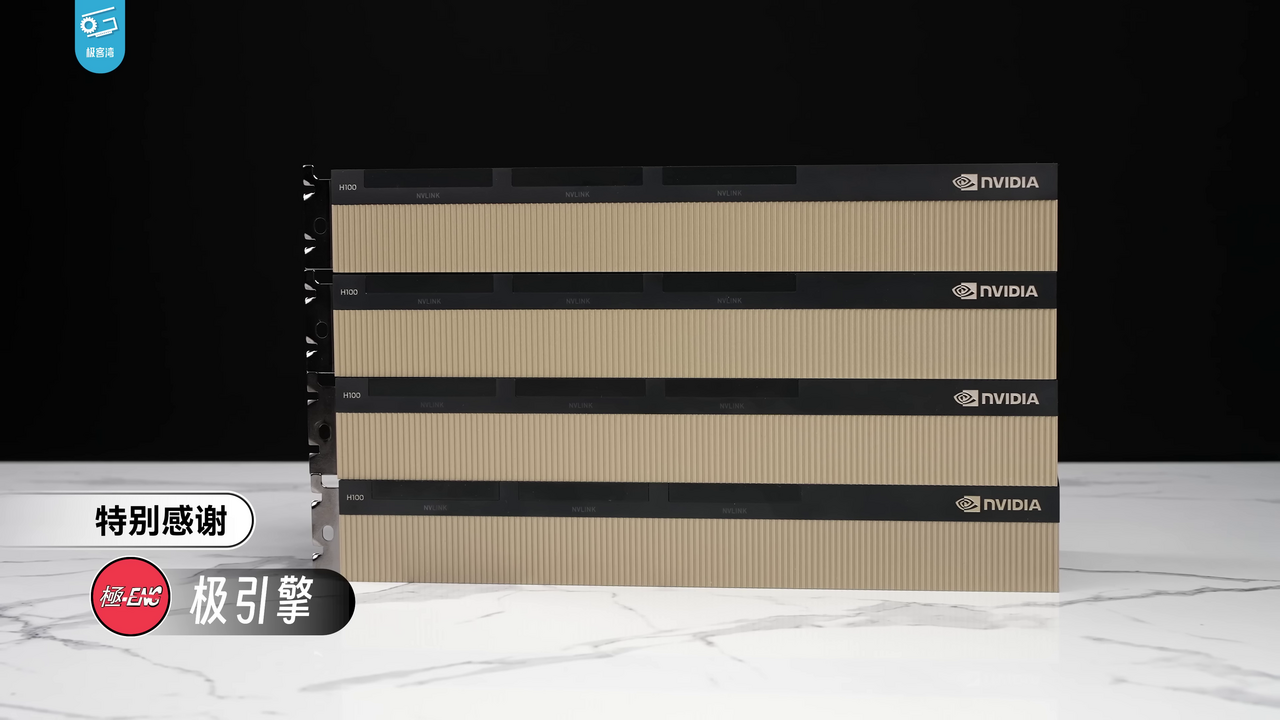
- Figure: NVIDIA H100 cards by Geekerwan, Wikimedia Commons, CC BY 3.0.