On October 28, 2026, Microsoft reported results for the first quarter of its fiscal year 2027, the three months ended September 30. Azure grew 48 percent, ahead of the company's own forecast of 44 to 45 percent. Capital spending came in at $45.2 billion, below an outlook of more than $50 billion. Both facts are real, and they are connected in a way that makes the quarter harder to read than the headline suggests: part of the gap between guidance and spending comes from GPU deliveries slipping into later quarters, and part comes from an accounting change in how Microsoft treats data center leases.
 Microsoft
 AWS
 Google
The headline numbers
According to Microsoft's results release, revenue was $92.3 billion, up 19 percent. Operating income was $45.9 billion, up 21 percent. GAAP net income was $36.6 billion, up 32 percent, and GAAP diluted earnings per share were $4.92. Non-GAAP earnings per share of $4.89 exclude net gains from OpenAI investments of $207 million, or $0.03 per share.
Azure is the line the market watches most. Microsoft reported Azure revenue of $33.2 billion, up 48 percent, and for the first time disclosed the figure in dollars. StockTitan's reading of the restated segment data puts the year-earlier figure at $22.4 billion, which is consistent with the 48 percent growth rate (33.2 divided by 22.4 is about 1.48). Tech Times, citing the earnings call, describes the prior quarter's growth as 42 percent on a recast basis, so the rate accelerated by roughly six points sequentially.
Reading the segments
Microsoft's restated reporting groups the business differently from earlier years. Agents and Infrastructure revenue was $76.8 billion, up 25 percent, with operating income of $40.6 billion. Devices and Consumer revenue was $15.5 billion, down 3 percent, with operating income of $5.4 billion. The growth is concentrated in the cloud and infrastructure side of the company, which is where the capital spending lands.
Azure accelerated again, but the more instructive numbers sit lower in the filing: how the spending is counted, and how much work has already been contracted but not started.
The capex number is really three numbers
The most useful way to understand the spending is to separate what is measured from how it is measured. Microsoft reported capital expenditures of $45.2 billion, a figure that, according to Tech Times, includes the full recognized value of data center finance leases that began in the quarter. On a cash basis, payments for property and equipment were $39.4 billion, up from $19.4 billion a year earlier, per the same coverage. The gap between the two is a consequence of lease accounting rather than of money that has not been spent.
Six quarters of Microsoft capital spending
Quarterly capex including finance leases, in billions of dollars, plus the December-quarter outlook of "above $50 billion".
Historical quarters as compiled by StockTitan from Microsoft results. The final bar marks the floor of the guided range, not a point estimate.
Using StockTitan's compiled series, quarterly capex including finance leases rose from $24.2 billion in the April to June 2025 quarter to $45.2 billion in the latest quarter. Year over year, spending grew roughly 30 percent against the $34.9 billion of the same quarter in 2025 (an arithmetic comparison from that series), while revenue grew 19 percent. StockTitan calculates that capex was about 49 percent of revenue, versus 45 percent a year earlier.
The outlook, however, called for more than $50 billion in the quarter, and the result landed below it. Chief Financial Officer Amy Hood said that the shortfall reflected GPU deliveries slipping into later quarters, which deferred cash payments, according to Tech Times. Microsoft guided the December quarter to capex above $50 billion as those payments arrive. Read together, the quarter looks less like restrained spending and more like timing.
The lease change
The second reason capex looks lower than planned is accounting. StockTitan reports that from July 2026 Microsoft treats data center buildings as having a useful life of 25 years instead of 15. A longer life lets more new leases qualify as operating leases, which sit outside reported capex, rather than finance leases, which are counted in it. Hood described the effect on the July call as adjusting the calendar 2026 capex expectation to approximately $175 billion, per StockTitan. Tech Times reports that Hood put calendar 2026 capex at about $170 billion on the October call, so the two summaries differ by about $5 billion and the exact figure is worth checking against the company's transcript.
New leased assets: the mix is moving to operating leases
Leased assets obtained in the quarter, in billions of dollars. Finance leases count toward reported capex; operating leases do not.
Source: Microsoft 10-Q figures as summarized by StockTitan. The mix shift follows Microsoft's change to a 25-year useful life for data center buildings.
The 10-Q data, as summarized by StockTitan, shows the mix moving. New operating lease assets were $6.5 billion in the quarter versus $1.4 billion a year earlier, while new finance lease assets fell to $5.2 billion from $9.1 billion. Leases that have been signed but have not yet started totaled $364.6 billion at September 30, up from $329.1 billion at June 30.
This matters for analysis because the same physical build can appear in different places depending on its lease structure. Comparisons of reported capex across companies, or across Microsoft's own quarters before and after July, are therefore not like for like. Operating lease payments still reach the income statement over time, and the signed-but-not-started figure is a reminder that a large commitment sits outside the capex line.
Cash flow: lower, but better than expected
Cash from operations was $58.0 billion. Free cash flow was $18.6 billion, down from $25.7 billion a year earlier but about $10 billion above analyst expectations, according to Tech Times. Hood attributed the beat mainly to the GPU delivery timing and to software efficiency gains. Microsoft said it expects to remain free-cash-flow positive for the full fiscal year.
Two cautions follow from that. First, a beat that comes from deferred payments is partly borrowed from later quarters, and the guided capex above $50 billion in December suggests it will be returned. Second, the year-over-year decline of about 28 percent (18.6 versus 25.7) shows that even a favorable quarter carries less free cash than a year ago.
Backlog: large and flat
Microsoft's commercial remaining performance obligation, the contracted revenue not yet recognized, was $677 billion at September 30, up 73 percent from a year earlier and roughly flat against $678 billion at June 30, per StockTitan. About 30 percent is expected to be recognized within 12 months. The release does not disclose how much of the backlog belongs to OpenAI. In July, Microsoft said that backlog growth excluding OpenAI was 25 percent year over year, and that all of the sequential increase in that quarter came from customers outside the frontier model labs. Hood also warned that large prior-year OpenAI contracts would make quarterly bookings volatile.
A flat sequential backlog is not a decline, since a very large contract base was already booked, but it does mean the growth story for the next several quarters depends on converting that backlog into revenue as capacity comes online. That ties the earnings line directly to the capex line.
Guidance and the capacity constraint
For the December quarter, Tech Times reports that Microsoft guided revenue of $96.0 to $97.1 billion, against a consensus of about $95.6 billion, and Azure growth of 49 to 50 percent in constant currency. Demand continues to exceed available supply, and some third-party GPU-as-a-service capacity that Microsoft had expected in the second quarter has shifted into the second half of the fiscal year, per the same coverage.
After the close, shares rose between roughly 4 and 5 percent in after-hours trading, according to StockTitan (4.1 percent to $552.55 at 4:14 p.m. Eastern) and Tech Times (about 5 percent). Those are after-hours moves, not the full-session reaction.
How it compares with the other hyperscalers
The same week brought results from Alphabet and Amazon, which we covered separately. The Register reported that Alphabet's Google Cloud revenue was $24.75 billion in its third quarter and that capital expenditure was $51.4 billion, with a 2026 capex forecast of $195 to $205 billion. Tech Times cites Amazon's reported AWS growth of 39.3 percent. Microsoft's Azure at 48 percent growth and $33.2 billion is a different measure from either, because the three companies define their cloud segments differently and Microsoft's figure includes restated components. The comparison is directional rather than precise.
What it means for AI buyers
For organizations that consume AI rather than build it, the quarter carries two practical signals. Capacity is still the binding constraint at the largest provider, with demand ahead of supply and some third-party capacity delayed. And the spending required to expand that capacity is large enough that its financing and accounting choices, such as the lease change, now shape reported results. Teams that can move workloads between models and providers are less exposed to any single provider's capacity schedule, which is the portability argument tools like Metir are built around, though it does not change the underlying supply picture.
What to watch next
- December quarter capex above $50 billion, to test whether the delayed GPU payments arrive as guided.
- Azure growth of 49 to 50 percent, to see whether acceleration persists as capacity comes online.
- Operating versus finance lease mix, since it determines how comparable reported capex is across periods.
- Backlog conversion, with commercial RPO flat sequentially at $677 billion.
- The calendar 2026 capex figure, given that coverage cites both $170 billion and $175 billion.
The takeaway
Microsoft's September quarter combined faster Azure growth with spending that was lower than planned for reasons that are mostly timing and accounting rather than restraint. Acceleration to 48 percent supports the argument that AI capacity is converting into cloud revenue. The lease change, the deferred GPU payments and the flat backlog are the details that determine how much weight the single-quarter numbers deserve.
Sources:
- FY27 Q1 Press Release | Microsoft Investor Relations
- Microsoft Q1 fiscal 2027 earnings: Azure growth and AI spending | StockTitan
- Azure Accelerates to 48% as Microsoft Free Cash Flow Beats Estimates by $10B | Tech Times
- Google struggling to make AI Mode searches pay | The Register
Image credits
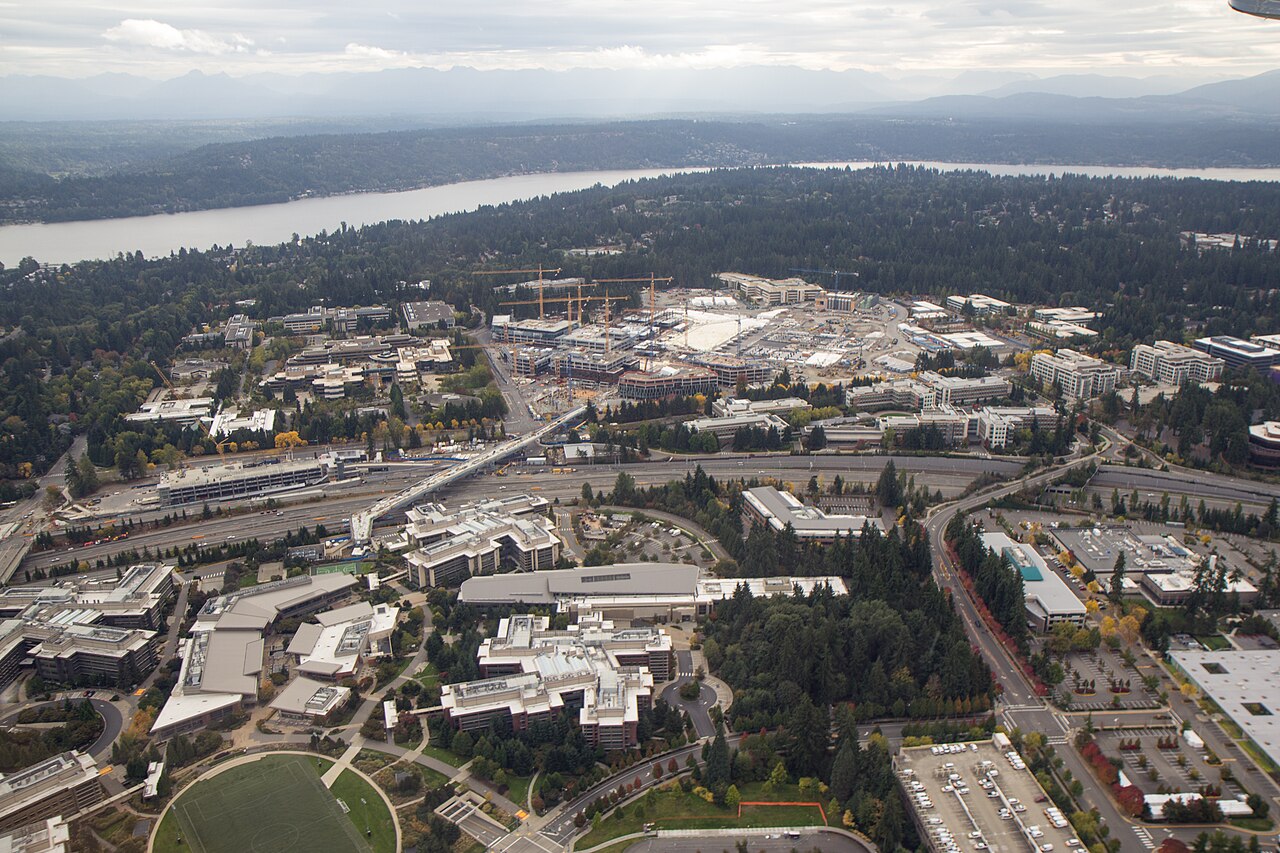
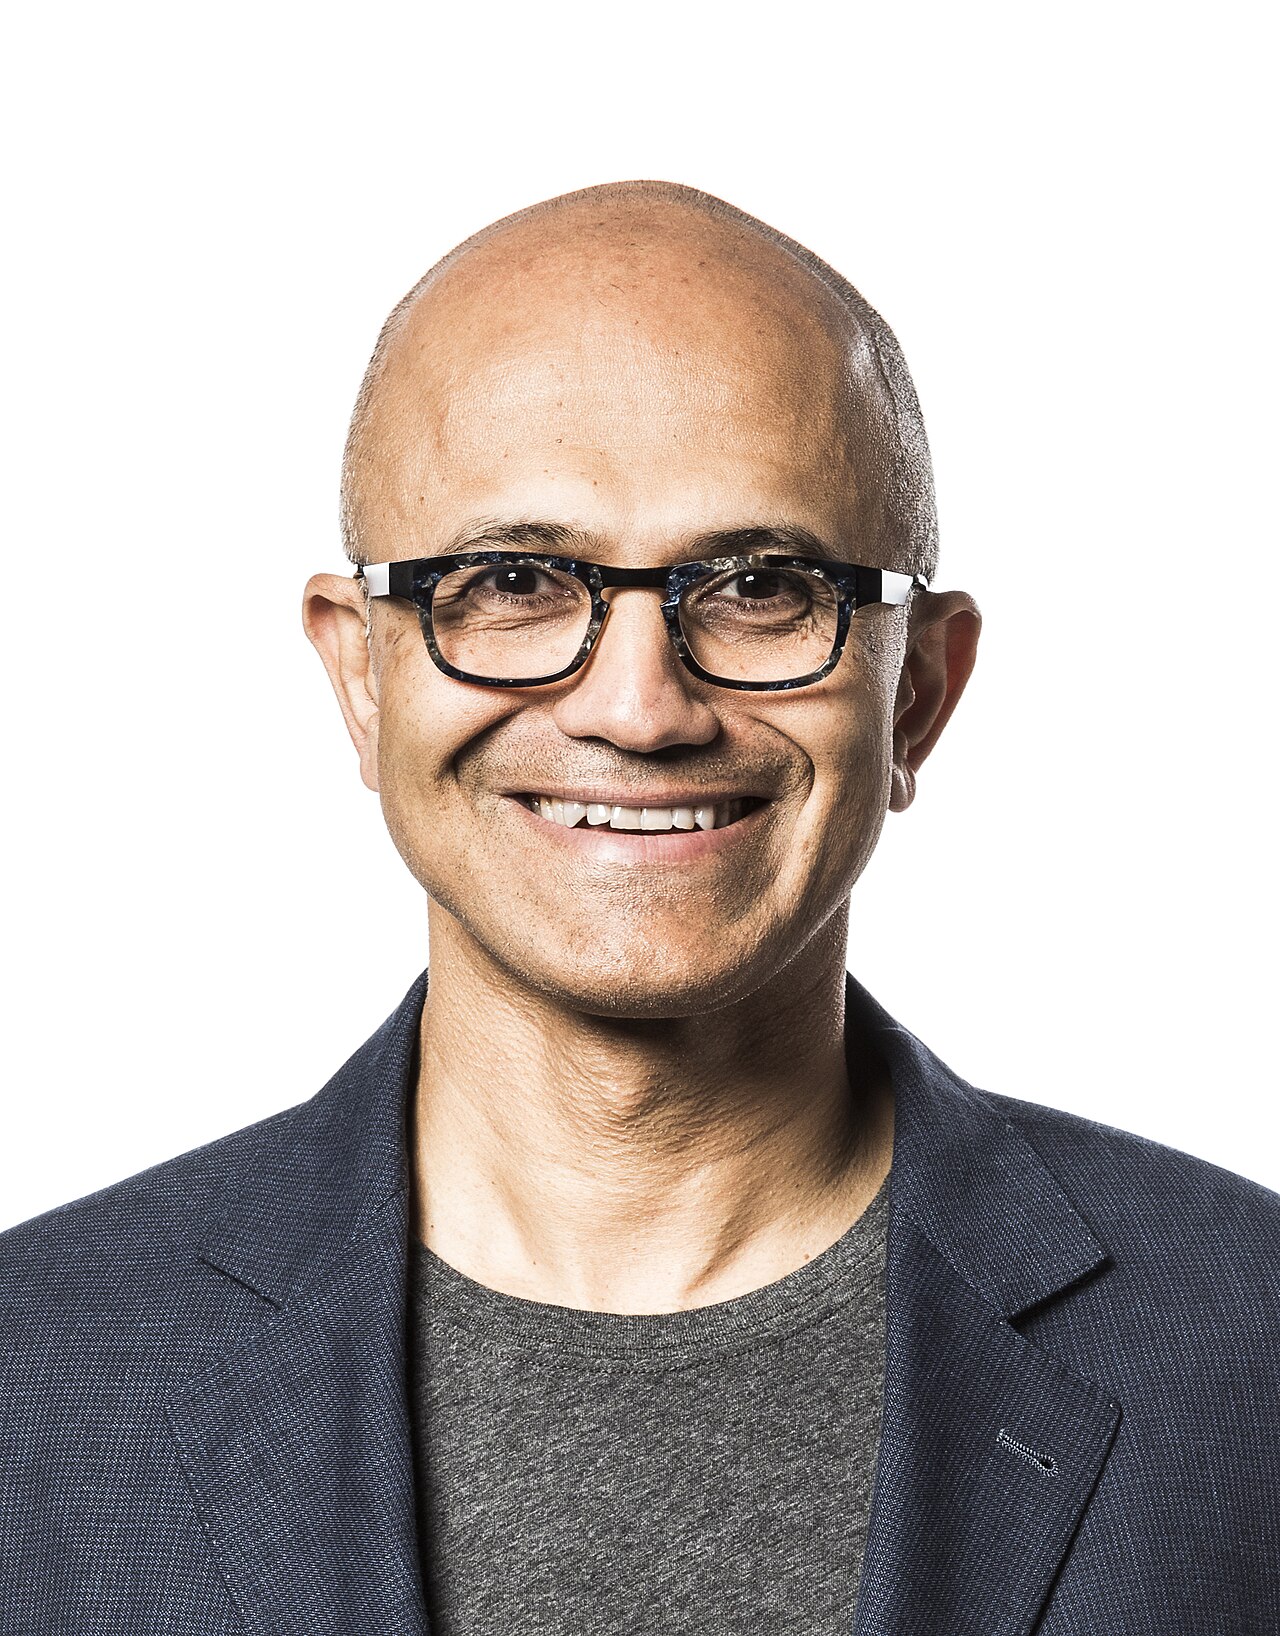
Header image: aerial view of Microsoft's Redmond campus by Coolcaesar, via Wikimedia Commons, licensed under CC BY-SA 2.0. In-body image: Satya Nadella, official Microsoft executive photo, via Wikimedia Commons, licensed under CC BY-SA 4.0.