On November 16, 2026, researchers led by Harvard's T.H. Chan School of Public Health published what they describe as a new estimate of the electricity use and carbon emissions of US hyperscale data centers. Using satellite imagery, the team identified 403 facilities and estimated that together they consumed between 68 and 99 terawatt-hours (TWh) of electricity between May 2024 and April 2025, roughly 1.8% of all US electricity use in that period. The associated carbon dioxide was estimated at about 25.7 million metric tons. This piece walks through what the study did, what a few simple calculations on its numbers imply, and the limits the authors themselves state.
What the study did
The paper, "Assessing the Carbon Emissions and Energy Consumption of US Hyperscale Data Centers," appeared in Nature Sustainability on November 16, 2026. Lead author Gianluca Guidi and corresponding author Francesca Dominici led a team that took three steps, as described in Harvard's release:
- Build the list. Satellite imagery was used to identify 403 hyperscale data centers across the United States.
- Estimate the electricity. Annual consumption for each facility was estimated for May 2024 to April 2025 under a range of operating scenarios, which is why the answer is a range (68 to 99 TWh) rather than a single number.
- Attribute the carbon. EPA data was used to assign CO2 to each facility based on the mix of power plants in its regional grid.
That third step matters. The same kilowatt-hour carries a very different carbon cost in a region dominated by hydropower than in one dominated by gas or coal, so where a data center sits can matter as much as how much it draws.
The headline numbers, in context
Where the power came from: 403 US hyperscale data centers
Share of electricity consumed by generation source, May 2024 to April 2025.
The release gives gas at 38% and coal at 15% of a roughly 54% fossil total; the remainder bar is derived as 100 minus 54.
The release reports that about 54% of the electricity consumed was fossil-generated, split into natural gas at 38% and coal at 15%. About a quarter of the electricity was used in grid regions with a dirtier-than-average mix. Four states, Virginia, Oregon, Ohio and Iowa, accounted for more than half of the electricity studied. The upper estimate, 99 TWh, is described as approaching the annual electricity use of Indiana, Michigan or Tennessee. The authors say the CO2 estimate is two to three times higher than an earlier estimate for 2018.
What simple arithmetic on the numbers implies
The following figures are our own back-of-envelope calculations from the published ranges, not results from the paper. They are meant to make the scale tangible, and they carry the uncertainty of the underlying range.
| Quantity | Calculation | Result |
|---|---|---|
| Average continuous load, low case | 68 TWh over 8,760 hours | about 7.8 GW |
| Average continuous load, high case | 99 TWh over 8,760 hours | about 11.3 GW |
| Average use per facility, low case | 68 TWh divided by 403 | about 169 GWh a year (about 19 MW average) |
| Average use per facility, high case | 99 TWh divided by 403 | about 246 GWh a year (about 28 MW average) |
| Implied carbon intensity | 25.7 million tons across 68 to 99 TWh | roughly 0.26 to 0.38 kg CO2 per kWh |
Two cautions apply. First, the release does not say which operating scenario the 25.7 million ton figure corresponds to, so the implied intensity is an illustration, not a reported statistic. Second, an average across 403 sites hides a wide spread: hyperscale campuses range from tens of megawatts to far larger, so the mean is a poor guide to any single site.
Data centers are growing incredibly fast, driven largely by AI.
Gianluca Guidi, lead author, in Harvard's release
Why the range is wide, and what it cannot tell us
The study is explicit about its boundaries:
- Not every facility is covered. The authors say there was not enough data to study all US hyperscale data centers.
- AI cannot be separated out. The data could not distinguish general-purpose cloud workloads from AI-specialized operations, so the study cannot say how much of the 68 to 99 TWh is attributable to AI.
- Health effects were not measured. The paper estimates emissions, not their health impact. Dominici says quantifying health impacts is an important next step.
- It is a snapshot. Guidi describes the work as only a snapshot of a rapidly expanding industry, and the release says current demand and emissions are likely much higher because the study period ended in April 2025.
That last point is the main reason to read the figures as a floor for the period they cover, not a current estimate. It also explains why analysts will likely compare this paper against utility filings, grid-operator forecasts and company sustainability reports, each of which measures something slightly different (capacity, contracted power, or reported consumption).
Three ways to read the result
Because the study stops short of assigning blame or prescribing policy, there are several fair readings:
- Concentration risk. With four states holding more than half of the studied load, local grid planning, water and permitting decisions carry outsized weight.
- Siting as a lever. Because carbon depends on the regional grid, the choice of where to build is a bigger emissions lever than the efficiency of any one rack, a point the authors raise when they call siting and power sourcing environmental and public health decisions.
- Measurement gap. Hyperscale operators publish aggregate figures, while this study works outward from satellite imagery. The two approaches are complementary, and the gap between them is itself a finding about transparency.
What it means for people who build with AI
For teams choosing models and providers, the practical takeaway is modest but real: compute is a physical resource with a location and a grid behind it, and efficiency differences between models (smaller models and shorter reasoning chains for easy tasks) translate into watts. Platforms that let you switch between models, such as Anthropic, OpenAI and Google options in a single workspace, make it easier to match model size to task size. That is a cost argument first and an energy argument second, and this study does not quantify the second.
 Anthropic
 OpenAI
 Google
Sources:
- Hyperscale data centers' energy consumption, carbon emissions newly estimated by researchers | Harvard T.H. Chan School of Public Health
- Assessing the Carbon Emissions and Energy Consumption of US Hyperscale Data Centers | Nature Sustainability (DOI 10.1038/s41893-026-01985-7)
- AI News for November 17, 2026 | AI Weekly
Image credits
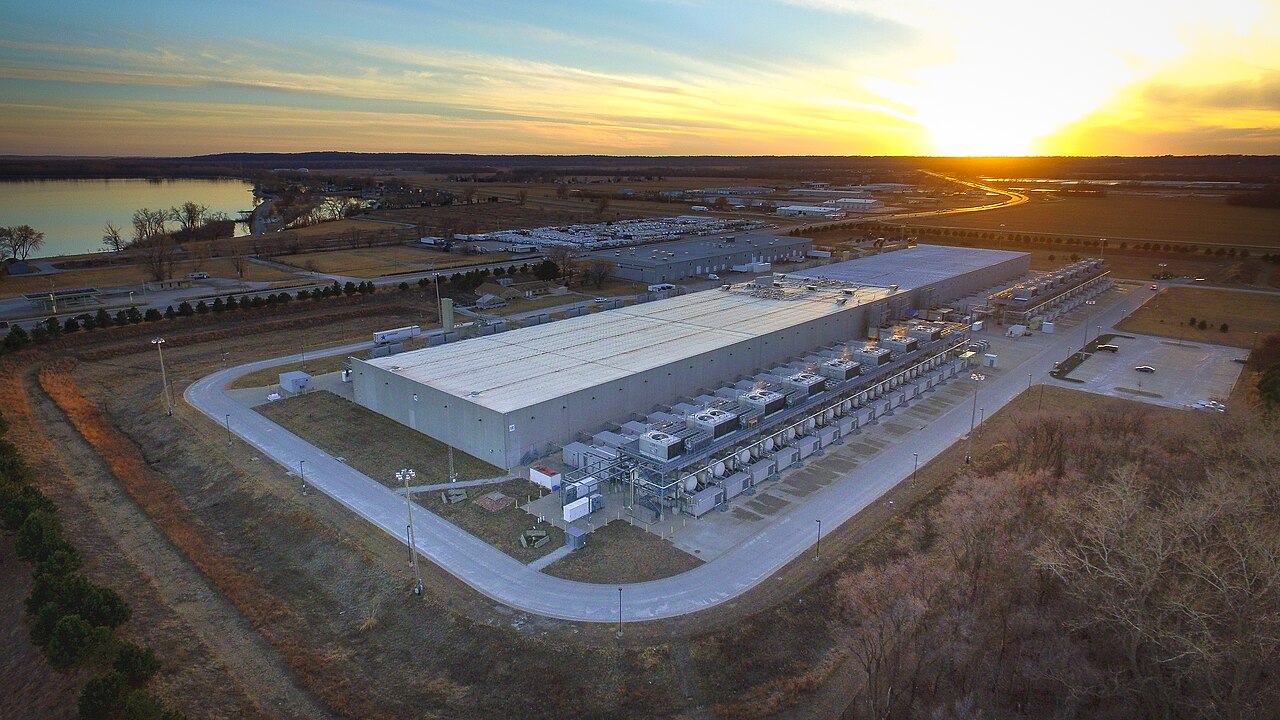
Header and in-body image: Google Data Center, Council Bluffs, Iowa, by Chad Davis via Wikimedia Commons, licensed under CC BY 2.0.